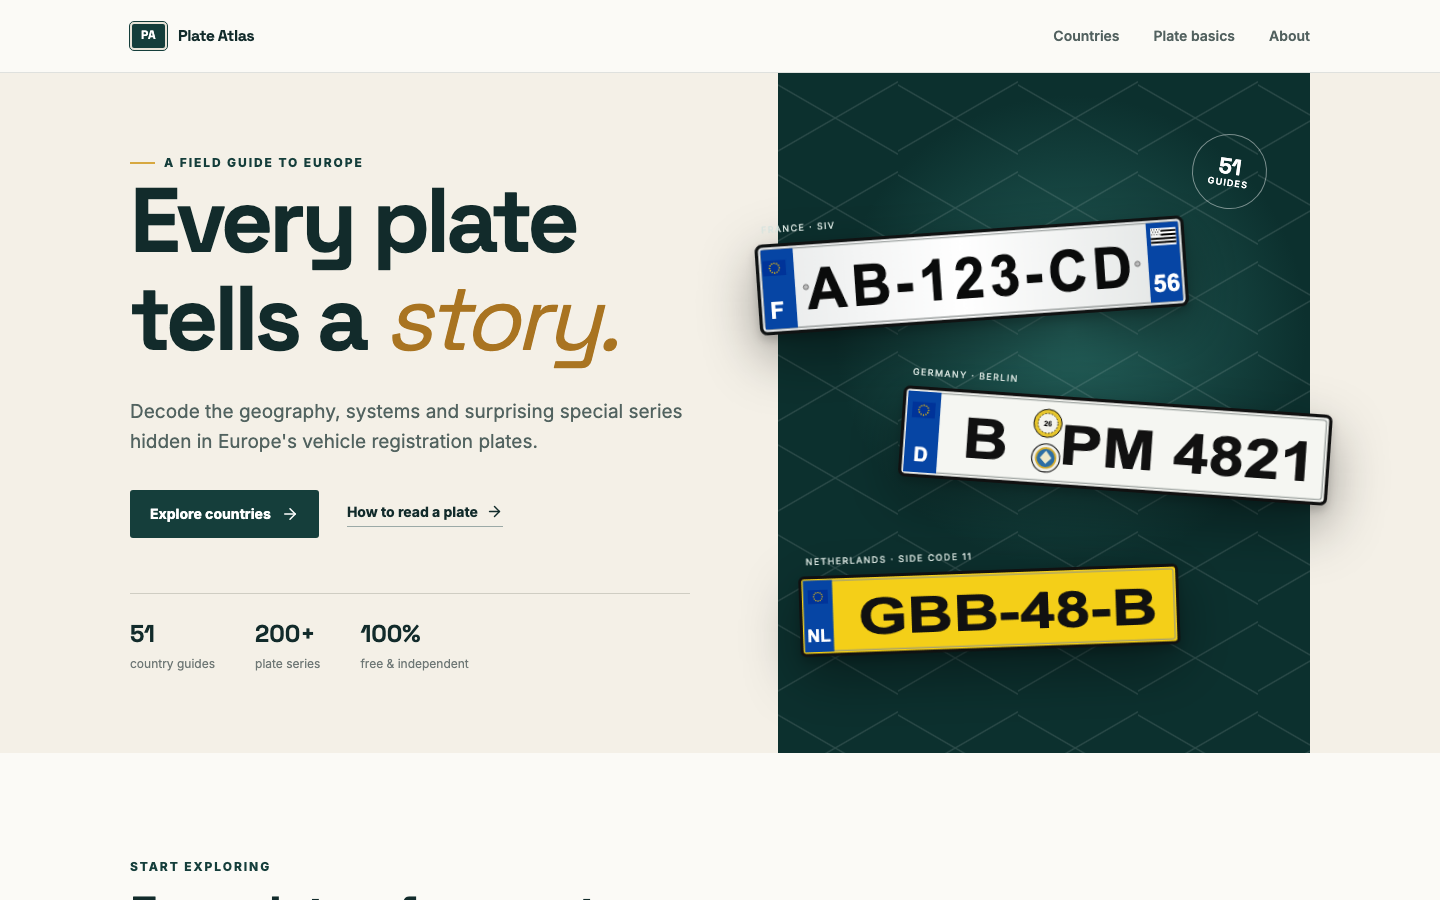
One Project a Month: Building Plate Atlas
This month I started a personal challenge: build one project every month. For July, I wanted the first project to come from a subject I genuinely enjoy rather than from a list of generic app ideas.
That subject was registration plates.
I have always liked the small facts hidden in plates: a letter that points to a city, a number that reveals a vehicle's age, a colour reserved for diplomats, or a format that changed because a country ran out of combinations. They are ordinary objects, but once you learn how to read them they become pocket-sized lessons in geography, history, design and administration.
That curiosity became Plate Atlas.
A field guide, not just a catalogue
Plate Atlas is a free, independent visual guide to European vehicle registration plates. It covers 51 registration systems—the 50 generally recognised European sovereign states, plus Kosovo as a separately documented system—and more than 200 plate series.
The goal was not to create an endless legal database. I wanted something a curious passenger could open after noticing an unfamiliar plate on the road and quickly understand:
- where geographic information appears;
- how the numbering sequence works;
- whether a plate can reveal the age of a vehicle;
- how diplomatic, military, temporary, historic and trade series differ;
- which visual clues are actually useful at a glance.
That decision shaped the whole product. Every guide explains the current standard in plain language first, then introduces the unusual families and historical context without burying the reader in codes.
The real challenge was consistency
Building the interface was only half of the work. The bigger challenge was turning information from 51 different systems into one consistent model.
Every country organises registration differently. France uses a national sequential system, Germany exposes a district code, the United Kingdom combines region and age, while Italy uses a national vehicle-bound sequence with optional regional decoration. Even the meaning of colours, side bands, seals and character groups changes from place to place.
I represented each country as structured TypeScript data: its current format, system, introduction date, numbering rules, identifiers, special series and useful facts. A coverage audit checks that every expected European country has a guide and that slugs remain unique. This made completeness something the project could verify instead of something I had to remember manually.
Rendering plates as interface components
The plates are not static screenshots. They are rendered through reusable React components, with dedicated variants for details such as European bands, national marks, seals, flags, crests, spacing and plate colours.
This approach keeps the examples visually consistent while still allowing each country's personality to come through. It also made the country browser more useful: visitors can search and filter the atlas while comparing real differences between systems instead of looking at generic placeholders.
The visual direction follows the same idea. Deep green, warm cream and restrained gold give the site the feeling of a printed field guide, while the plate illustrations remain the main source of contrast.
The stack
Plate Atlas is built with Next.js 15, React 19 and TypeScript. The interface uses custom CSS and SVG assets rather than a component library. The production build also uses Vinext, and the public site is deployed on Vercel.
Keeping the stack small helped me focus on the information architecture, reusable plate rendering and the editorial quality of the guides.
What I learned from the first monthly project
A one-project-a-month challenge needs a clear finish line. For Plate Atlas, that line was not “document every plate ever issued.” It was a complete, coherent first edition: all 51 country systems represented, the most useful series explained, a shared visual language, and an experience that stays free and ad-free.
The project reminded me that curiosity is a strong product brief. A small observation from the passenger seat can grow into a structured dataset, a design system and a useful public reference.
This is the first entry in my project-a-month experiment. I am looking forward to seeing what next month's curiosity becomes.